Quick hit:
Feb 2024 U.S. Video Game Market Highlights from Circana - Projected U.S. total spending on video game hardware, content and accessories grew 2% in Feb vs YA, to $4.7B. 17% growth in Mobile content spending vs YA helped offset a 30% drop in hardware. (Mobile source: Sensor Tower)
US Video Game Projected Total Market Consumer Spending - 13 month rolling consumer spending by month and change versus prior year. Note: January 2024 was a 5-week tracking period, while January 2023 was a 4-week tracking period.

Hardware
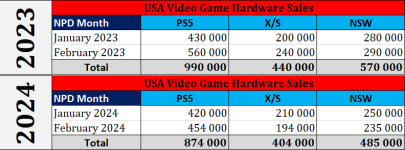
February video game hardware spending declined 30% when compared to a year ago, to $349 million. All console platforms were down a minimum of 19% compared to a year ago.
PlayStation 5 led the February and year-to-date hardware market in both unit and dollar sales. Nintendo Switch finished 2nd in unit sales, while Xbox Series placed 2nd in dollars across both time periods.
PS5 comparison 2023/2024
Thanks to @Evilms cimosrsin chart

Software
To go along with the growth in Mobile, February 2024 consumer spending in the PC, Cloud and Non-Console VR content segment increased by a high single-digit percentage when compared to a year ago, while both the Console as well as the Subscription content segments declined.
Helldivers II debuted as the best-selling premium game of the year. Helldivers II launch month dollar sales represent the 7th highest total ever achieved by a Sony published title in the U.S. (excludes add-on content). Nearly 60% of Helldivers II sales in Feb came from Steam.
Final Fantasy VII Rebirth was the #2 best-selling premium game of February, instantly becoming the 4th best-selling game of 2024 YTD. Also debuting on the chart in February was the Final Fantasy VII Remake & Rebirth Twin Pack, placing 8th in February and at #16 for the year.
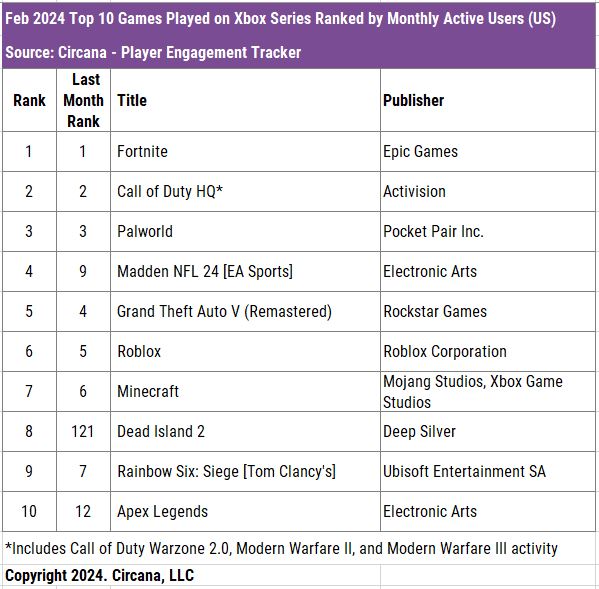
Dead Island 2 was released on Xbox Game Pass Ultimate in February without an announcement from either Microsoft or publisher Plaion prior to its release. This helped Dead Island 2 jump from #121 in Xbox Series monthly active users in January to 8th on the February chart.
Mobile
Sensor Tower reports the top 10 Mobile games by U.S. consumer spend in Feb and rank chg vs Jan as: MONOPOLY GO!, Royal Match, Roblox, Candy Crush Saga, Pokémon Go (+5), Coin Master (-1), Whiteout Survival, Clash of Clans (+1), Jackpot Party – Casino Slots (-1), and Township (-4).
“The biggest news this month is that Sensor Tower data now shows that US mobile gaming spend is up a whopping 17% year-on-year in February 2024. This lift looks to be due to... games like MONOPOLY GO!, which didn't exist a year ago,” said Samuel Aune of Sensor Tower.
“Pokémon GO had some of its biggest annual events in February, leading to a 60% increase in spend for the month over its January 2024 revenue… Township drove 20% less spend than the previous month," said Samuel Aune of Sensor Tower.
Accessories
Accessories spending in February grew 25% when compared to a year ago to $219M, driven in part by a 14% increase in Gamepad spending and the new Remote Play Devices accessories segment (which includes PlayStation Portal).
PlayStation Portal was the best-selling Accessory of February in dollar sales, while the PS5 Dual Sense Edge Wireless Controller remains the best-selling accessory of 2024 year-to-date
February 2024 Top 20 Best-Selling Premium Games - U.S. (Dollar Sales, Physical and Digital from digital data sharing publishers, excludes add-on content)

Year-to-Date Ending February 2024 Top 20 Best-Selling Premium Games - U.S. (Dollar Sales, Physical and Digital from digital data sharing publishers, excludes add-on content)

Monthly Active User Engagement
Top 10 Games Played on PlayStation 5 Ranked by Monthly Active Users (US)

Top 10 Games Played on Xbox Series Ranked by Monthly Active Users (US)

Top 10 Games Played on Steam Ranked by Monthly Active Users (US)

Rankings
Units: PS5 > NSW > XBS
Revenue: PS5 > XBS > NSW
Update
Each console is down at least 19% YOY
Feb 2024 U.S. Video Game Market Highlights from Circana - Projected U.S. total spending on video game hardware, content and accessories grew 2% in Feb vs YA, to $4.7B. 17% growth in Mobile content spending vs YA helped offset a 30% drop in hardware. (Mobile source: Sensor Tower)
US Video Game Projected Total Market Consumer Spending - 13 month rolling consumer spending by month and change versus prior year. Note: January 2024 was a 5-week tracking period, while January 2023 was a 4-week tracking period.
Hardware
February video game hardware spending declined 30% when compared to a year ago, to $349 million. All console platforms were down a minimum of 19% compared to a year ago.
PlayStation 5 led the February and year-to-date hardware market in both unit and dollar sales. Nintendo Switch finished 2nd in unit sales, while Xbox Series placed 2nd in dollars across both time periods.
PS5 comparison 2023/2024
Thanks to @Evilms cimosrsin chart
Software
To go along with the growth in Mobile, February 2024 consumer spending in the PC, Cloud and Non-Console VR content segment increased by a high single-digit percentage when compared to a year ago, while both the Console as well as the Subscription content segments declined.
Helldivers II debuted as the best-selling premium game of the year. Helldivers II launch month dollar sales represent the 7th highest total ever achieved by a Sony published title in the U.S. (excludes add-on content). Nearly 60% of Helldivers II sales in Feb came from Steam.
Final Fantasy VII Rebirth was the #2 best-selling premium game of February, instantly becoming the 4th best-selling game of 2024 YTD. Also debuting on the chart in February was the Final Fantasy VII Remake & Rebirth Twin Pack, placing 8th in February and at #16 for the year.
Dead Island 2 was released on Xbox Game Pass Ultimate in February without an announcement from either Microsoft or publisher Plaion prior to its release. This helped Dead Island 2 jump from #121 in Xbox Series monthly active users in January to 8th on the February chart.
Mobile
Sensor Tower reports the top 10 Mobile games by U.S. consumer spend in Feb and rank chg vs Jan as: MONOPOLY GO!, Royal Match, Roblox, Candy Crush Saga, Pokémon Go (+5), Coin Master (-1), Whiteout Survival, Clash of Clans (+1), Jackpot Party – Casino Slots (-1), and Township (-4).
“The biggest news this month is that Sensor Tower data now shows that US mobile gaming spend is up a whopping 17% year-on-year in February 2024. This lift looks to be due to... games like MONOPOLY GO!, which didn't exist a year ago,” said Samuel Aune of Sensor Tower.
“Pokémon GO had some of its biggest annual events in February, leading to a 60% increase in spend for the month over its January 2024 revenue… Township drove 20% less spend than the previous month," said Samuel Aune of Sensor Tower.
Accessories
Accessories spending in February grew 25% when compared to a year ago to $219M, driven in part by a 14% increase in Gamepad spending and the new Remote Play Devices accessories segment (which includes PlayStation Portal).
PlayStation Portal was the best-selling Accessory of February in dollar sales, while the PS5 Dual Sense Edge Wireless Controller remains the best-selling accessory of 2024 year-to-date
February 2024 Top 20 Best-Selling Premium Games - U.S. (Dollar Sales, Physical and Digital from digital data sharing publishers, excludes add-on content)

Year-to-Date Ending February 2024 Top 20 Best-Selling Premium Games - U.S. (Dollar Sales, Physical and Digital from digital data sharing publishers, excludes add-on content)

Monthly Active User Engagement
Top 10 Games Played on PlayStation 5 Ranked by Monthly Active Users (US)

Top 10 Games Played on Xbox Series Ranked by Monthly Active Users (US)

Top 10 Games Played on Steam Ranked by Monthly Active Users (US)

Rankings
Units: PS5 > NSW > XBS
Revenue: PS5 > XBS > NSW
Update
Each console is down at least 19% YOY
Attachments
Last edited:


